Data Visualization in Excel | Agenda Bookshop Skip to content
A01=Jonathan Schwabish
Age Group_Uncategorized
analysis
Author_Jonathan Schwabish
automatic-update
Category1=Non-Fiction
Category=UFC
Category=UFCE
Category=UYZF
Cell D1
chart
Chart Area
Chart Design
CMD.
code
Column Charts
Combine Charts
Conditional Formatting
COP=United Kingdom
Data Labels
data visualization
dataset
Delivery_Pre-order
Design
Dollar Sign
eq_computing
eq_isMigrated=2
eq_non-fiction
Error Bars
excel
Excel Spreadsheet
Follow
Format Axis
Format Data Series
graphics
graphs
Home Tab
Label Position
Language_English
Line Chart
Maximum Category
Orange Dots
PA=Temporarily unavailable
Price_€50 to €100
PS=Active
research
Select Cells
Select Data
softlaunch
Stacked Bar Chart
Switch Row
Vertical Error Bars
Wo

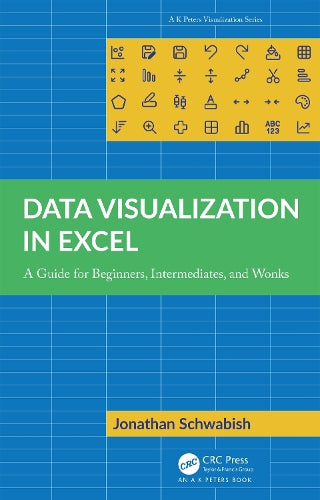
Data Visualization in Excel

English

By (author): Jonathan Schwabish

This book closes the gap between what people think Excel can do and what they can achieve in the tool. Over the past few years, recognition of the importance of effectively visualizing data has led to an explosion of data analysis and visualization software tools. But for many people, Microsoft Excel continues to be the workhorse for their data visualization needs, not to mention the only tool that many data workers have access to. Although Excel is not a specialist data visualization platform, it does have strong capabilities. The default chart types do not need to be the limit of the tool’s data visualization capabilities, and users can extend its features by understanding some key elements and strategies. Data Visualization in Excel provides a step-by-step guide to creating more advanced and often more effective data visualizations in Excel and is the perfect guide for anyone who wants to create better, more effective, and more engaging data visualizations.

See more
€94.99
A01=Jonathan SchwabishAge Group_UncategorizedanalysisAuthor_Jonathan Schwabishautomatic-updateCategory1=Non-FictionCategory=UFCCategory=UFCECategory=UYZFCell D1chartChart AreaChart DesignCMD.codeColumn ChartsCombine ChartsConditional FormattingCOP=United KingdomData Labelsdata visualizationdatasetDelivery_Pre-orderDesignDollar Signeq_computingeq_isMigrated=2eq_non-fictionError BarsexcelExcel SpreadsheetFollowFormat AxisFormat Data SeriesgraphicsgraphsHome TabLabel PositionLanguage_EnglishLine ChartMaximum CategoryOrange DotsPA=Temporarily unavailablePrice_€50 to €100PS=ActiveresearchSelect CellsSelect DatasoftlaunchStacked Bar ChartSwitch RowVertical Error BarsWo

Will deliver when available.

Product Details
  • Weight: 1020g
  • Dimensions: 174 x 246mm
  • Publication Date: 31 May 2023
  • Publisher: Taylor & Francis Ltd
  • Publication City/Country: GB
  • Language: English
  • ISBN13: 9781032343280

About Jonathan Schwabish

JONATHAN SCHWABISH is an economist and data communication expert. Dr Schwabish is considered a leader in the data visualization field and is a leading voice for clarity and accessibility in research. He is a senior fellow at the Urban Institute, a non-profit research institution in Washington, D.C., and is the founder of the data visualization and presentation skills firm, PolicyViz.

Customer Reviews

Be the first to write a review
0%
(0)
0%
(0)
0%
(0)
0%
(0)
0%
(0)
We use cookies to ensure that we give you the best experience on our website. If you continue we'll assume that you are understand this. Learn more
Accept